
Showing posts with label RDLC Reports. Show all posts
Showing posts with label RDLC Reports. Show all posts
Thursday, November 24, 2016
Load multiple RDLC reports at the same time
When there are multiple RDLC reports and you want to load data to that reports at the same time, set AsyncRendering="false" in every report without one report.

Wednesday, November 16, 2016
Format RDLC report to export to an excel, group wise with expanded data
- Bind data to a dataset.
- Use a matrix to present the data.
- If you want expanded data within the group, the highlighted check box should be unchecked.


- If you want to export this report to an excel sheet wise by name, it can be done by changing page break options under Group Properties.
Show report header on all work sheets
- Click that small drop down arrow at the right corner of column groups as below.

- Select the first static member under Row Groups, and set "KeepWithGroup" as After and "RepeatOnNewPage" as True.

- This will now copy the headers on all worksheets.


Thursday, October 27, 2016
Format RDLC report to export to an excel, group wise
- Bind data to a dataset.

- Use a matrix to present the data.


- If we want to export this report to an excel sheet wise by name, it can be done as follows.
- Right click on the "Name" in Row groups and select Group Properties.
- Mark the check box as follows.


- After exporting to an excel it will be like this.

- If we want to get the "Name" as sheet name, instead of Sheet1, Sheet2....it can be done with the following simple modification.
- First select the "Name" group in the Row Groups pane so that its properties are displayed in the Properties pane. In the Properties pane, locate the Group > PageName property and specify the following expression:
- Result will be like this.

Format report based on conditions (SSRS) (Part2)
- Assume that there are multiple datasets, and we want to do a calculation in a textbox using multiple values from multiple datasets.

- Add a textbox to the report, and write the expression as fallowing.
=First(Fields!StartersIssueValue.Value, "StartersIssue")- First(Fields!StartersReturnValue.Value, "StartersReturn") -First(Fields!StartersClosingValue.Value, "StartersClosing") [/code]
- When getting the total of a particular value, it can be written like this.

Change the background color based on a condition

- Select the table row and set background properties as follows.

[code]
=SWITCH(Fields!Font.Value ="1B", "#dcf9db",Fields!Font.Value ="1N", "#dcf9db", Fields!Font.Value="2B", "#cee9c3",Fields!Font.Value="2N", "#cee9c3")
[/code]
- Result will be like this.

Data Driven Colored Text for Reporting Services Reports
Sunday, October 2, 2016
Format report based on conditions (SSRS) (Part1)
- Bind the data set to the report.
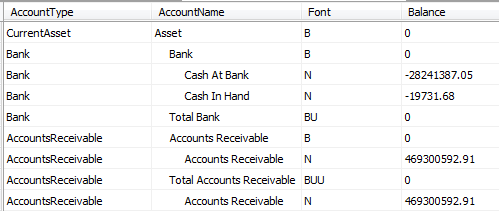
- Select the "Font" text box and set font properties as follows.

- Select the "Balance" text box and set Border style properties as follows.
Top
[code] =iif(Previous(Fields!Font.Value) ="BUU","Double","Solid") [/code]
Bottom
[code] =iif(Fields!Font.Value = "BUU","Double","Solid") [/code]
- For the double lines, set Border width properties as follows.
Top
[code] =iif(Previous(Fields!Font.Value) ="BUU","3pt","1pt")[/code]
Bottom
[code] =iif(Fields!Font.Value = "BUU","3pt","1pt") [/code]
- Result will be like this.

- You can see that the bottom row also should have double lines as the font is "BUU", but there is only a single line. Just simply add an extra row below the table.

Tip: When there are double lines ,
MSDN thread suggests a few requirements to get this running:
- The border width must be 3pt at least.
- There must be at least one row beneath the Double border text box.
Tuesday, September 20, 2016
Dynamically bind data to an rdlc report and load report within a popup window (Part2)
To display the report within another popup window, you have to add some lines to the same code.
Just remove the last line of this method and modify the method as shown as below.
[code] private void getDataSetNames(DataTable[] datatables) { ReportDataSourceCollection dataSources = ReportViewer1.LocalReport.DataSources; this.ReportViewer1.LocalReport.DataSources.Clear(); IList
Friday, July 8, 2016
Dynamically bind data to an rdlc report(Part1)
From this post I'm going to describe how to bind dynamic data to an rdlc report. In here it loads data to the report based on selected value of a drop down. That means we can display different reports based on given parameters.
- First of all we will do the design of the web page (with a dropdown,a button and a reportviewer)

- Then add code behind methods as below.
[code] protected void btnview_Click(object sender, EventArgs e) { string id = ddlId.SelectedValue; string filename = string.Empty; string[] queries = null; if (id == "1") { filename = "Test7-1"; string query1 = "select id,lat from Test3 where id=" + id + ""; string query2 = "select lng,colorId from Test3 where id=" + id + ""; queries = new string[2]; queries[0] = query1; queries[1] = query2; } else if (id == "2") { filename = "Test7-2"; string query1 = "select id,lat from Test3 where id=" + id + ""; string query2 = "select lng,colorId from Test3 where id=" + id + ""; queries = new string[2]; queries[0] = query1; queries[1] = query2; } runRptViewer(filename, queries); ReportViewer1.Visible = true; } private void runRptViewer(string fileName,string[] queries) { DataTable[] datatables = fillDataTables(queries); string reportpath = @"D:\Madara\Reports\" + fileName + ".rdl"; this.ReportViewer1.Reset(); this.ReportViewer1.LocalReport.ReportPath = reportpath; getDataSetNames(datatables); } private DataTable[] fillDataTables(string[] queries) { int queryCount = queries.Length; DataTable[] datatables = new DataTable[queryCount]; for (int i = 0; i < queryCount; i++) { DataTable dt = page6Service.getData(queries[i]); datatables[i] = dt; } return datatables; } private void getDataSetNames(DataTable[] datatables) { ReportDataSourceCollection dataSources = ReportViewer1.LocalReport.DataSources; this.ReportViewer1.LocalReport.DataSources.Clear(); IList
- Values of the sql data table.

- Result will be like this.


Create a report (RDLC) to show one record per page
- Bind the data set to the report.

- Suppose you want to group the data based on Ref No.
- Add a List control.
- Drag and drop any attribute from data set inside to that List control.
- Right click on Details, under Row Groups and select Group Properties.
- Under General tab, click add and select "Ref No" from Group on.

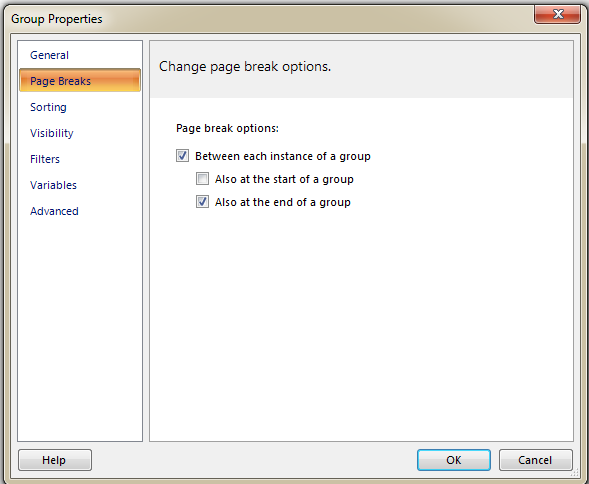
- Under Page Breaks tab, select the page break options as follows.
- Then you can design your report as you want.


Subscribe to:
Posts (Atom)